We've been using spatially balanced stratified study designs more frequently at work these days. They are a good way to make probabilistic inference over large areas. A popular method of creating these designs is using the R function spsurvey::grts() . The following is a basic (very basic) explainer of how to get up and running with grts() function and what it is. But a bit about GRTS and spatially balanced study design before we get coding.
Generalized Random Tessellation Stratified sampling is a method to draw points randomly across a stratified polygon or line (doesn't necessarily need to be stratified). If you want to get into the weeds you can read the original paper for the design here. For me, it's only important that I understand that spatially balanced survey designs are probability-based survey designs that specify where to sample so that inferences from the sample apply to the entire population. In other words, its a method to randomly draw points so that they cover an entire population or area. Non-spatially balanced random samples, another popular method, have a tendency to cluster points and have no method to make sure the entire population is covered.
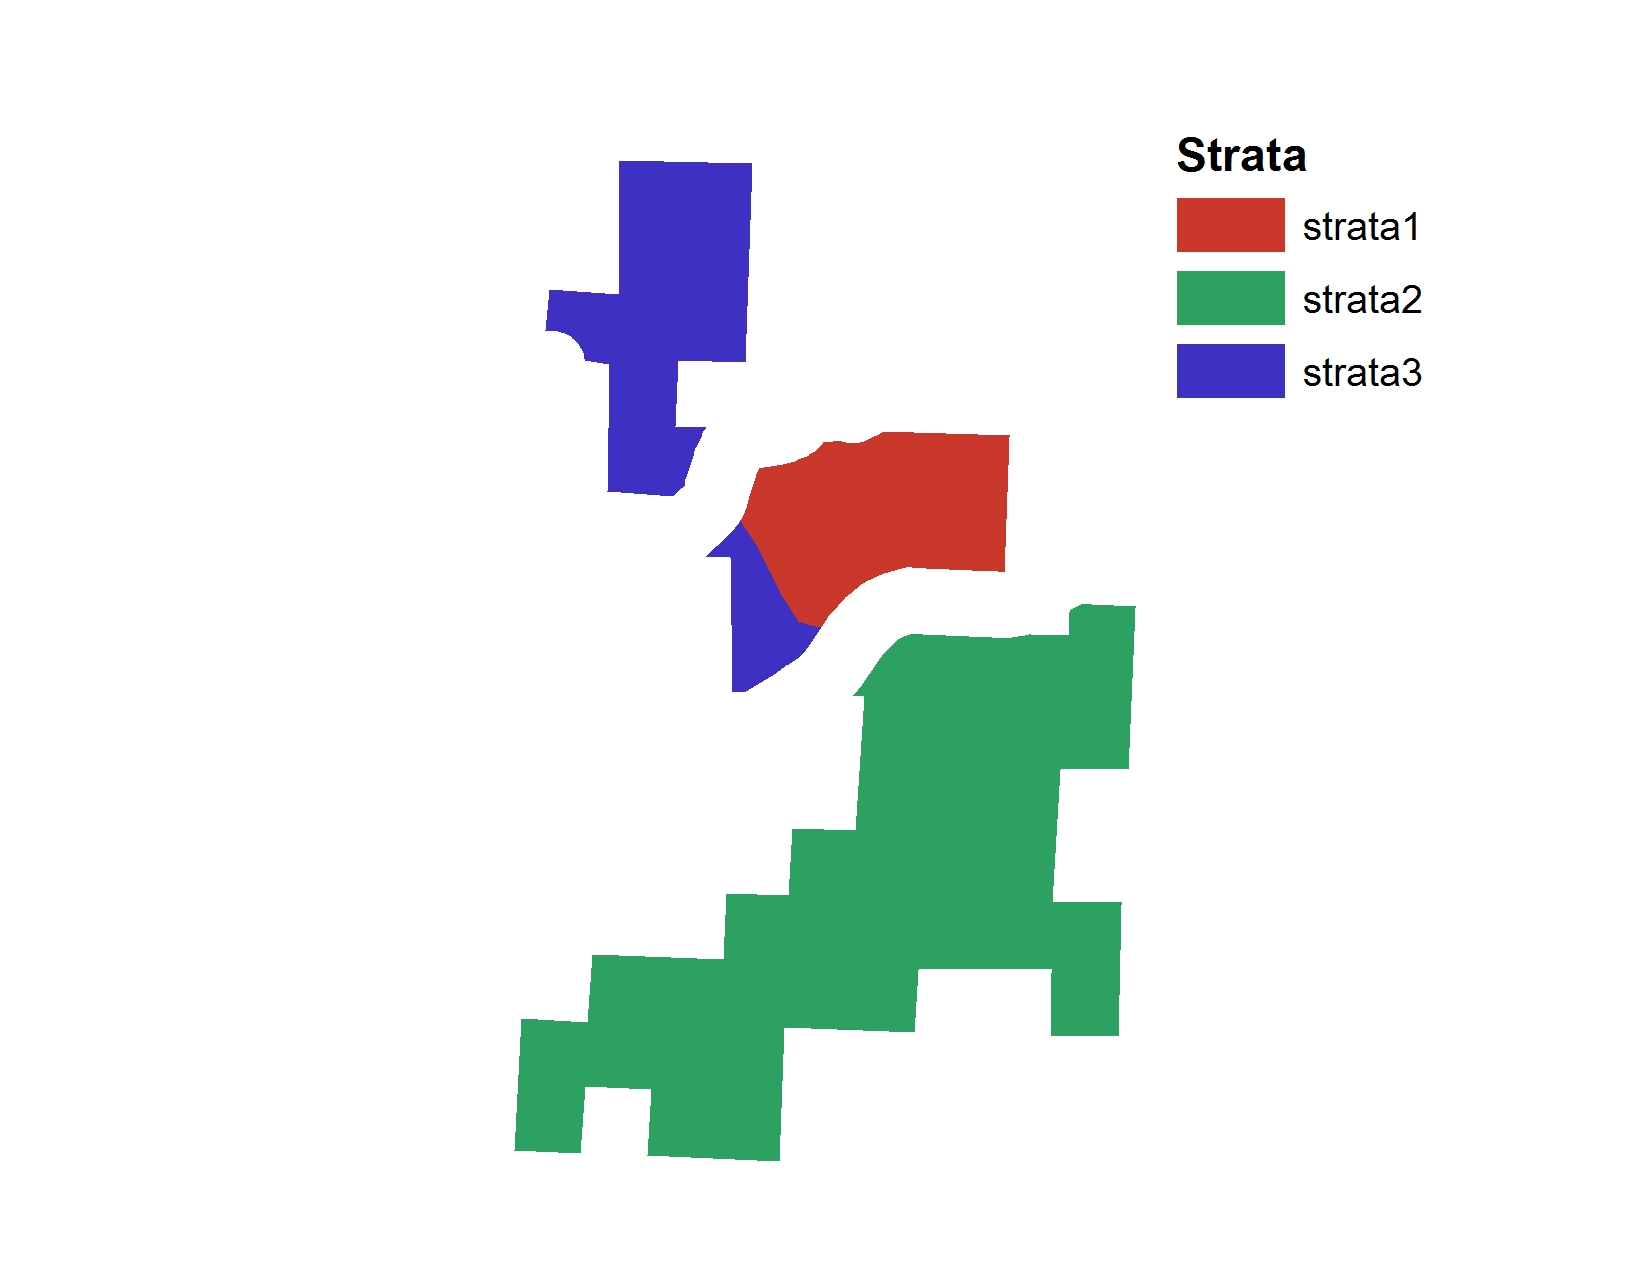
Step 1 - Make a Shapefile in ArcGIS with a field that represents your strata Make a shapefile with your desired strata. We want to monitor wildlife in a recreation area across three strata. Strata 1 has no recreation trails, strata 2 has newly constructed recreation trails and strata 3 has historic recreation trails going back 20 plus years. All are in important habitats for big game.
You need to provide grts() a shapefile with a strata variable. I used ArcMap to do this but you can also use QGIS or other free GIS software. The result of our strata looks like this:
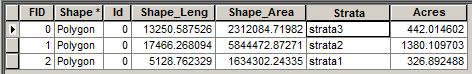
Again: it's really important that the polygons are in a single shapefile and there is a field that represents what strata you want. The shapefile tabular data should look something like this:
Step 2 - R Code: Create a GRTS sample design One of the trickiest parts for me was understanding the first function parameter of grts() , design. The documentation for design reads:
Named list of stratum design specifications which are also lists. Stratum names must be subset of values in stratum argument. Each stratum list has four components:
And then lists the details for panel, seltype, caty.n and over. Take a peak at the documentation for more details here.
designlist(
strata2 = list(panel=c(set1=6), seltype="Equal", over=6),
strata1 = list(panel=c(set1=3), seltype="Equal", over=3),
strata3 = list(panel=c(set1=3), seltype="Equal", over=3)
)
In my case I only needed panel, and over parameters. Let's break this down. You need to store your list() of design features in a variable that you will later call in the grts() function. In this case we've named it design . Next, within the list, you need a list element that has a name that is the same as your shapefile strata. In my case the strata are called strata1, strata2, and strata3, so I have three list elements with those names. Next each element needs a panel, seltype, and over value. seltype can be left on the default "Equal" .
Step 3 - Drawing the sample
The code first then we can break it down:
## From the last step
designlist(
strata2 = list(panel=c(set1=6), seltype="Equal", over=6),
strata1 = list(panel=c(set1=3), seltype="Equal", over=3),
strata3 = list(panel=c(set1=3), seltype="Equal", over=3)
)

## GRTS code
test.sample  grts(design=design,
DesignID="Phil's Game Camera Abundance Study",
type.frame="area",
src.frame="shapefile",
in.shape="strata/final_strata_acres.shp",
stratum="Strata",
shapefile=TRUE,
out.shape="points/for_blog.shp")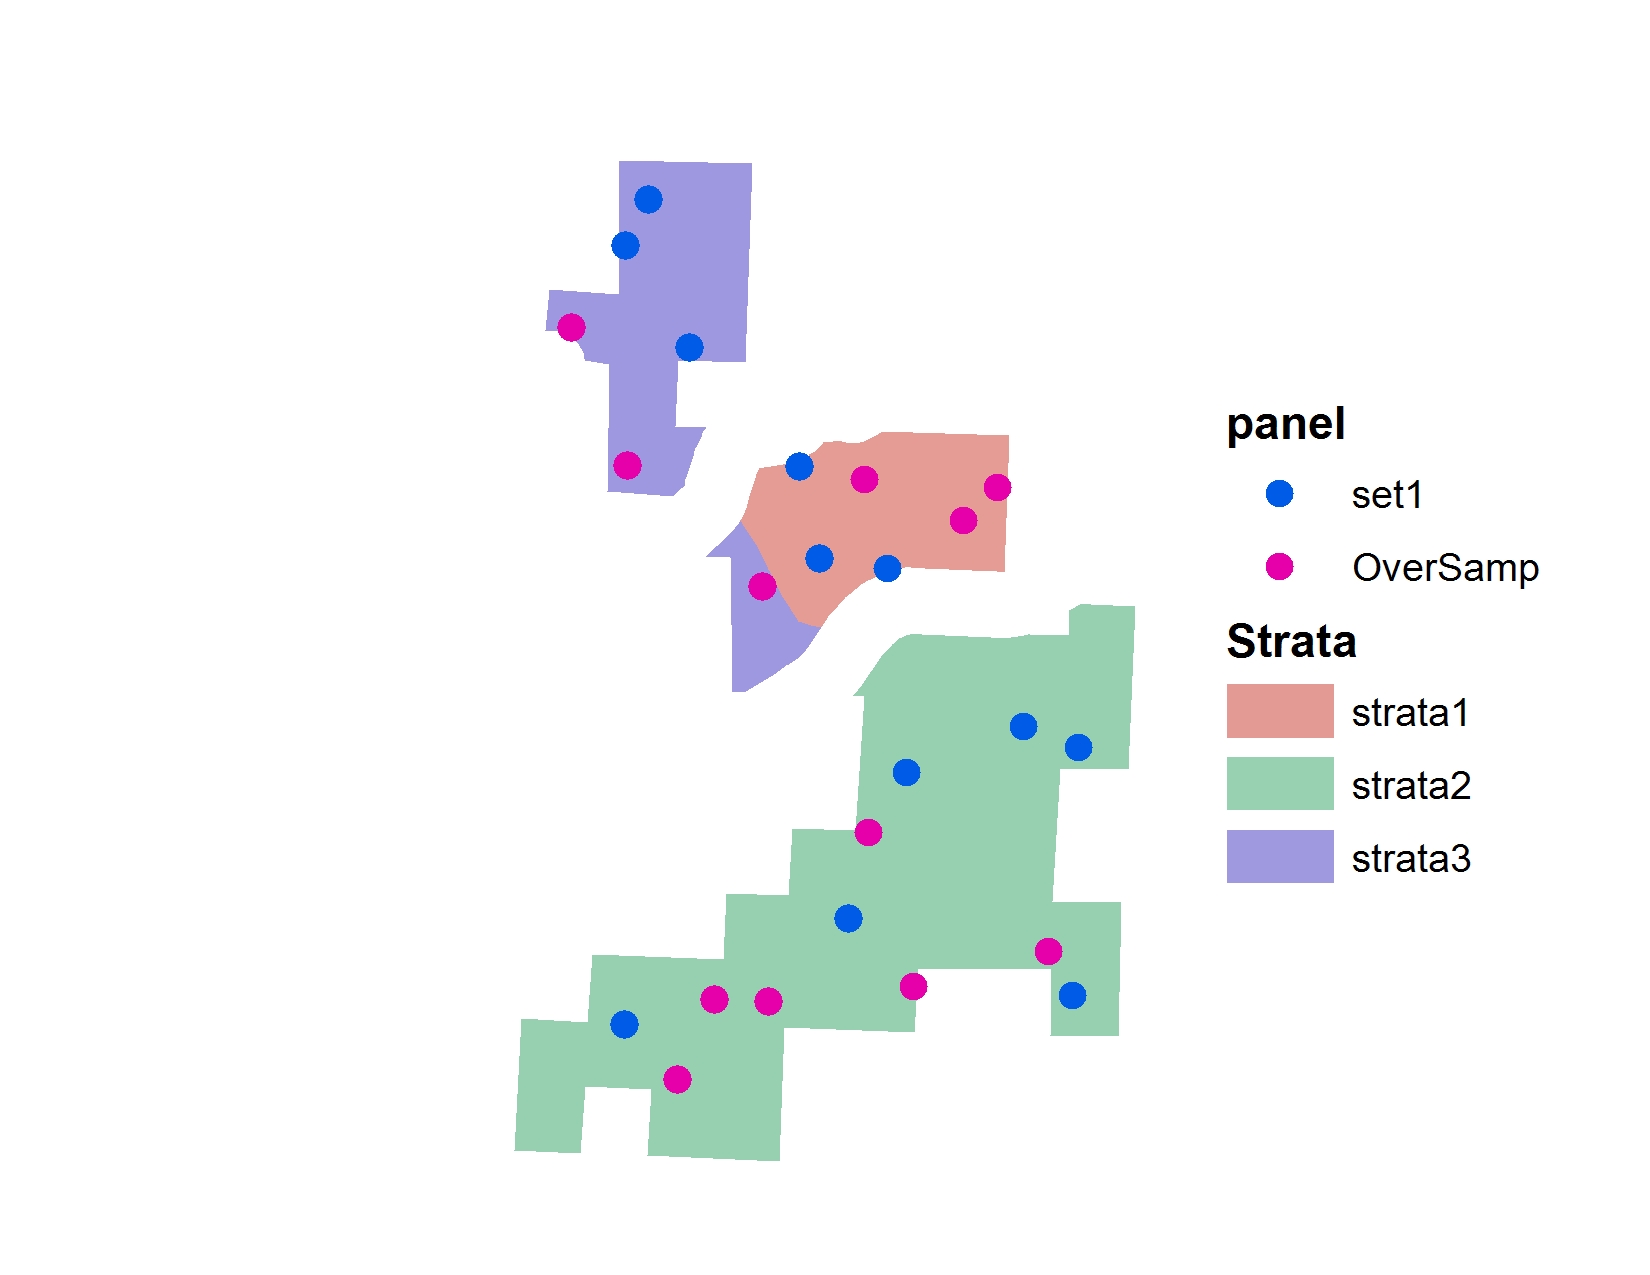
And the resulting points draw:
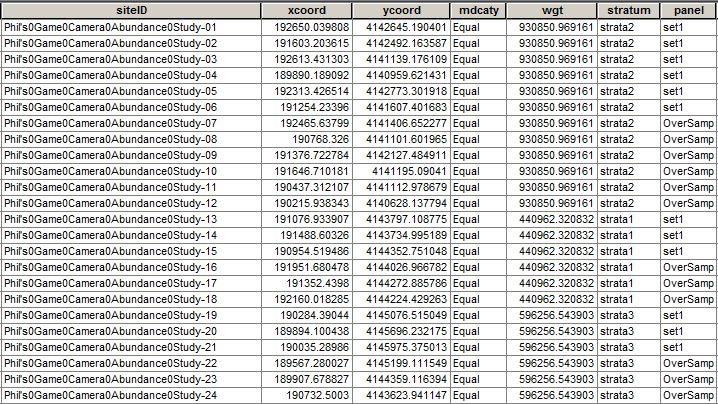
And table:
Let's break this down:
Thanks for reading. If you find this content interesting or helpful consider donating to a junior cycling program called High Desert Devo that I'm involved with.